
Effective money management is crucial for personal financial well-being and wealth building.Excel has an extensive library of features and formula functions.
Therefore, it comes in handy as a powerful spreadsheet tool that can help you in your financial journey.
It simplifies and manages the budget-making process by tracking spending, savings, and even planning for investments.
Also, Excel features are automated, thus saving you time when performing tasks.
“The global economy is built on two things: the internal combustion engine and Microsoft Excel. Never forget this.”
— Kevin Hector, Twitter
In this guide, we will explore essential financial calculations using Excel.
We shall complement it with relevant Bible verses that offer timeless wisdom on stewardship.
The Most Popular Excel Functions (fx) That You Will Find Useful.

1) SUM Function
It adds up values, which can be individual,cell reference, a range of cells, or all three mixed.
They are commonly used in budget-making.
To view the formula for a cell, select it and type =SUM. It will appear on the formula bar, as shown below.
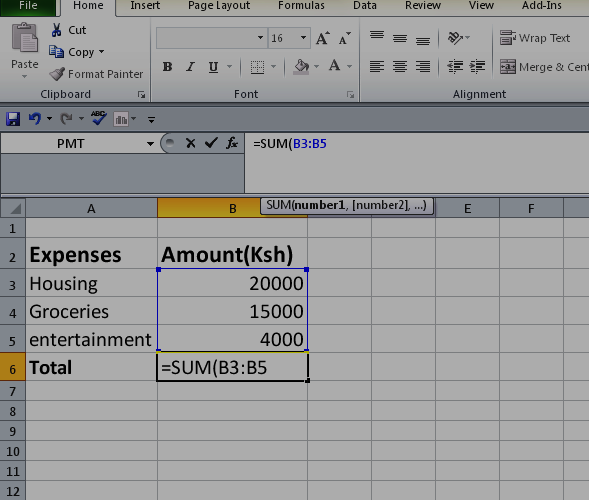
How to use the =SUM function in Excel
Section 1: Building a Budget with Excel
Remember, budgeting will always form the basis for any financial planning.
Excel, therefore, can give you the ability to personalize your budget.
With a spreadsheet created on a workbook for your budget, you can easily track your income, spending, savings, and even investments.
To track your income, you need to:
Step #1: Open an Excel spreadsheet and create a column for all your income sources, i.e., your salary, business income returns from investment, etc.
Step #2: Enter their respective amounts
#3: Calculate their total (sum).
A Practical Example
Mary takes home Ksh. 100,000 from her paycheck.
She gets an average of Ksh. 20,000 per month from her side hustle.
Her monthly expenses are as follows:
- housing: Ksh. 15,000,
- car loan: Ksh. 20,000,
- shopping and groceries: :Ksh. 20,000,
- electricity/water bills: Ksh. 5,000,
- house help: Ksh. 6,000,
- transport fuel: Ksh. 12,000,
- savings: Ksh. 10,000,
- her child’s education: Ksh. 5,000,
- Entertainment (home internet, airtime, etc.): Ksh. 5,000.
Her savings account is Ksh. 500 000, and she plans to invest.
Let’s help her prepare for that investment
Firstly;
We need to open an Excel sheet.
Then, create a budget template and fill in the amounts given.
We shall do this while considering that the budget is subject to review.
Let’s have three columns in our Excel sheet.
Column A is for categories, and columns B and C are for the estimated and actual amounts, respectively, as shown below

We can use the SUM to get her total income and expenses to determine a surplus or deficit.
For total income, we need to highlight cells B5 and B6, go to the home tab, and click on Auto sum.

That click should give us a total of Ksh. 120,000 in cell B7.
Alternatively, use the keyboard and press (Alt+ =)
We can do the same for the total expenses.
To determine her savings,we subtract her total expenses from her income

Our work results in a Ksh. 23,000 surplus over her budget estimates, assuming she sticks to them.
She needs to fill out the actual amount column for review to keep her financial goals on track.
These will help her make the necessary adjustments to her spending.
When we create a table based on her data, this is how her income compares to her expenses.

Section 2: Tracking Expenses and Savings
Mary can monitor her spending patterns by utilizing tools like pie charts to visualize the distribution of her expenses.
Luke 16:10(NIV)
“Whoever can be trusted with very little can also be trusted with very much,
and whoever is dishonest with very little will also be dishonest with much.”
To track her expenses,
Step #1: categorize the expenses into needs and wants.
Step #2: have their appropriate amounts allocated daily, weekly, or monthly
#3: Keep track of how much is spent.

POINTS TO NOTE:
You can highlight and sort your data as desired by using sort and filter, which are just next to SUM on the home tab.
Average can be used to calculate the average of the values in a range in order to assess your monthly spending patterns.
Hence, you can quickly identify areas you need to adjust to save more.
You can add visual indicators by using different font colors and customizing the borders of selected cells or information for easy readability.
You can also use a pie chart or a graph to break your data into manageable information.
To do this, click Insert, which is next to the home tab, and under chart tools, you can choose whatever suits you, i.e., if it is bar, pie, etc.
Remember to select the information you want to appear in the chart tool.

Excel then generates a pie chart that shows how your actual expenses compare with the budgeted amounts over the month.
Consider visualizing your data if you want to set attainable goals.
These can help you quickly identify trends and stay motivated on your financial achievement journey.
Section 3: Calculating Net Worth and Financial Goals
It would help if you tracked your net worth to live below your means and achieve your financial goals.
NET WORTH =ASSETS-LIABILITIES
Still on Mary;
Her assets include:
- A salary account.
- A savings account.
- National Social Security accounts (NSSF).
- Pension scheme outstanding balances.
- A car.
We need at least two months of data to calculate Mary’s net worth.
Assuming she renews her comprehensive car insurance in January at Ksh. 30000,
Then our Excel sheet should look like this:

POINTS TO NOTE:
Those entries represent outstanding balances of respective accounts to reflect the actual net worth.
Salary and side hustle incomes are excluded.
This is because income is only a component of cash flows and thus does not contribute to net worth.
The asset value changes with time; that’s why we have demonstrated that a car depreciates. If she owned land, the land value would have been appreciated.
The net worth constantly changes at some point in time.
For instance, between January and February, there was a net worth change of Ksh. 21,535 and Ksh. 28,334 between February and March.
These show some positivity, meaning there was an upward trend in net worth.
Therefore, your focus should be on something other than net worth, but the net worth trend.
Your net worth is a picture of your finances at some point.
Just as you compare your present picture with the snapshot you took a while ago, you can do the same to see the change in your finances.
These changes will determine how you review your budget to stay on track toward achieving your goals.
2)=PMT Function
It calculates loan repayment based on constant payments and interest rates over a given period.
The formula is as follows:
= PMT (Rate, Nper, Pv, [Fv], [Type])
Where;
Rate=interest rate of the loan
Nper=total number of payments per loan taken
Pv=present value (loan principal)
Fv=future value, i.e., the last balance you want to be attained after the final payment is made.
Type = is a logical value. Where 1 represents the beginning of payment and 0 is the end of payment (omitted). It’s an optional argument.
How to Use PMT in Excel
Using Mary’s information,
Let’s assume she plans to invest in real estate and needs an additional Ksh. 600,000 to her savings to buy land. She goes to her bank to get the loan at a 14% annual flat rate and has to repay the loan in 5 years.
Let’s work out.
First, we open our Excel spreadsheet and fill in the details.
We then select a cell where we want our answer to appear.
Then, on the menu tab, we find more functions, as shown at Auto-Sum.

When we click on more functions, an insert function table will appear; we select a financial category, scroll down to choose a PMT function, and click OK.

The function arguments table will appear, where we can fill in the details as required.

These will automatically give us –13960.95051, symbolizing outgoing payments as per the general cash flow convention.
The opposite would have been true if the value had been positive, i.e., incoming payments.
The above formula function gives PMT as 13,960.95051, which is the value of the payment to be made every month for the loan.
Click OK on the table, and the result will automatically show up in the cell you selected, as shown below.

But this value (13,960.95) only includes the principal value and interest rate.
The processing fee, excise duty (tax fee), and insurance are excluded.
Common Errors you are Likely to Encounter and What to Consider When Using the PMT Function in Excel
1) #NUM!: This error will occur when the rate value given is ≤ -0.1 and also when Nper value given = 0
2) #VALUE!: This error occurs when non-numerics are provided in any of the arguments.
3) #NAME?: The error occurs when you have left out an opening parenthesis.i.e.,(
4) The loan repayment is on a monthly basis. Therefore, there is a need to convert the annual interest rate into a monthly one and convert years into months. I.e., 0.14/12 for monthly interest and 5×12=60 months for Mary’s case
5) PMT may compute your worth in dollars ($). It’s important to type your brief description in the search box for accuracy. In this case, type PMT in Kenya shillings and click Go to have the results in your desired currency.
Although the formula result will show in $, ignore the sign since you already commanded the function to work with your desired currency.
6) To find out the total amount that was paid during the loan period, as in this case, multiply PMT by Nper.
So the total amount that Mary will pay at the end of the loan period will be:
=Ksh 13,960.95*60 months
= Ksh. 837, 657
PMT, therefore, will help Mary strategize on her loan repayment plan.
Proverbs 22:7(NIV)
“The rich rule over the poor,
and the borrower is servant to the lender.”
“Nobody sets out to create a mission-critical spreadsheet; they ‘just happen’. ”–Felienne Hermans
in “Analyzing and visualizing spreadsheets”
Conclusion: Walking in Financial Wisdom With Excel
Excel is a powerful and versatile tool in personal finance management.
Its formula library empowers you to take control of your money.
You can easily create a budget, track spending, and analyze your financial data.
When you use Excel to its full potential, your financial decisions are more informed.
You can quickly identify areas for adjustment to achieve your goal of building wealth.
Incorporate these financial calculations and heed the timeless wisdom found in the Bible.
And you will always strive towards financial freedom and stewardship.
May your financial journey be guided by wisdom and faith
No responses yet